
.png)

TL;DR:
- Interpreting sustainability metrics involves understanding what each indicator measures, how it was calculated, and its implications for business performance.
- Most organizations treat sustainability data as a reporting obligation rather than a management tool, leading to costly gaps.
- Reliable metrics should have clear formulas, framework alignment, appropriate cadence, disaggregation, and a defined retirement rule if unused in decisions.
Sustainability metric interpretation is the process of extracting decision-relevant meaning from environmental, social, and governance data by understanding what each number measures, how it was calculated, and what it implies for business performance. Managers who know how to interpret sustainability metrics can distinguish a genuine improvement in carbon efficiency from a statistical artifact, spot greenwashing in a supplier’s report, and satisfy CSRD, EcoVadis, and EU Taxonomy requirements without drowning in data. Frameworks like GRI, SASB, and IRIS+ exist precisely to standardize this process, yet most organizations still treat sustainability data as a reporting obligation rather than a management tool. That gap is costly, and this guide closes it.
How to interpret sustainability metrics: types and key properties
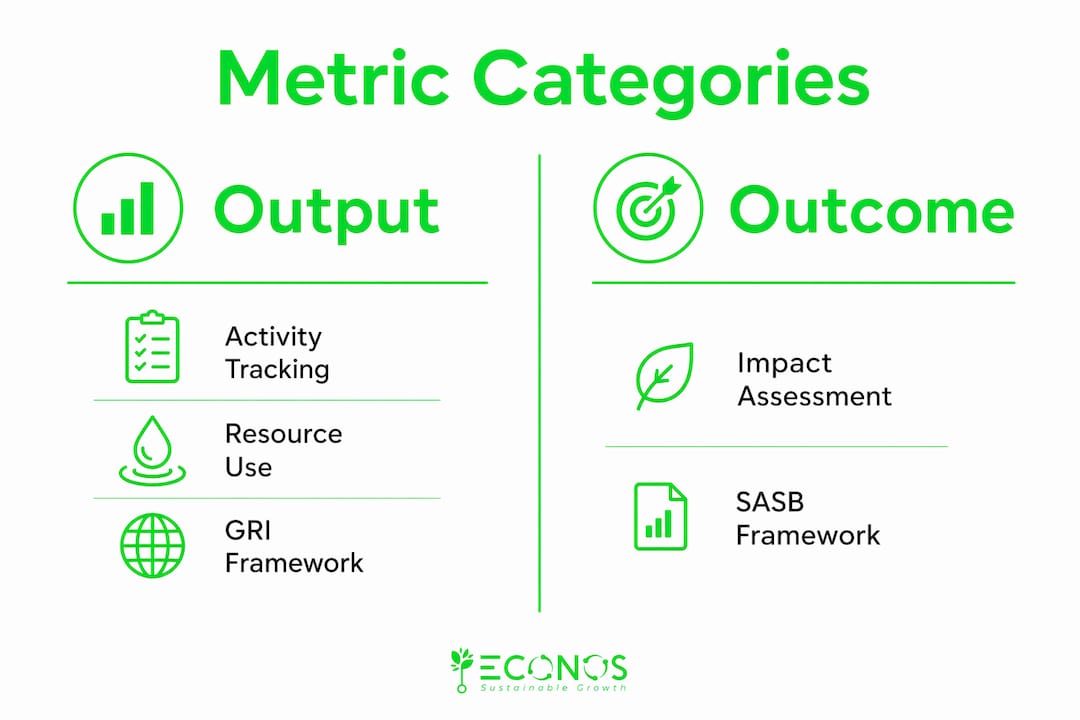
Sustainability metrics fall into four distinct categories: output, outcome, composite, and benchmark or longitudinal. Output metrics count activities, such as megawatt-hours of renewable energy purchased. Outcome metrics measure actual change, such as a reduction in Scope 1 CO2 emissions. Composite metrics aggregate multiple indicators into a single score, like an EcoVadis rating. Benchmark and longitudinal metrics track performance against a peer group or over time, making trend analysis possible.

Every defensible metric shares five properties regardless of category. It has an explicit formula with a clear numerator and denominator. It aligns to a recognized framework such as GRI, SASB, or IRIS+. It specifies a measurement cadence, whether monthly, quarterly, or annual. It includes disaggregation logic so you can break the number down by business unit, geography, or stakeholder group. And it carries a retirement rule: a metric unused in decisions for six months becomes documentation, not a KPI.
The table below maps metric categories to their primary use cases and the frameworks that govern them.
| Metric type | Primary use case | Common frameworks |
|---|---|---|
| Output | Activity tracking and resource accounting | GRI, SASB |
| Outcome | Impact measurement and target-setting | IRIS+, ESRS |
| Composite | Benchmarking and investor communication | EcoVadis, MSCI ESG |
| Benchmark/longitudinal | Trend analysis and peer comparison | CDP, Sustainalytics |
Understanding which category a metric belongs to changes how you read it. An output metric tells you what you did. An outcome metric tells you what changed. Conflating the two is one of the most common errors in sustainability reporting, and it leads to strategies that optimize activity without improving impact.
Key properties to verify before trusting any metric:
- Formula transparency: Can you reproduce the number from raw data?
- Framework alignment: Does the metric follow GRI, SASB, ESRS, or another recognized standard?
- Disaggregation: Can the figure be broken down by site, product line, or employee group?
- Cadence: Is the measurement frequency appropriate for the decision it informs?
- Retirement logic: Is there a defined threshold for retiring the metric if it stops informing decisions?
How do composite ESG scores differ from individual metrics?
Composite scores are weighted aggregations of individual indicators, and the weights are not neutral. MSCI ESG ratings weight environmental, social, and governance factors differently depending on the industry. Sustainalytics ESG risk ratings focus on unmanaged risk exposure rather than absolute performance. Two companies with identical carbon emissions can receive very different composite scores because one operates in a high-risk sector and the other does not. ESG scores reflect relative risk within an industry, not universal moral judgments about a company’s behavior.
The most dangerous misinterpretation managers make is treating a composite score improvement as evidence of absolute environmental progress. A company can appear 20% more carbon-efficient on an intensity basis while its absolute emissions rise 10%. Intensity metrics divide emissions by revenue or production volume, so revenue growth alone can make the ratio look better even when total pollution increases. For planetary impact and climate risk, absolute volume data is what matters.
Common misinterpretations to avoid when reading composite scores:
- Assuming comparability across industries: A score of 65 in manufacturing and 65 in financial services reflect entirely different risk profiles.
- Ignoring methodology documents: Every major rating provider publishes a methodology guide. Reading it once will save you from misreading scores repeatedly.
- Treating score improvements as impact reductions: A rising score can reflect better disclosure rather than better performance.
- Overlooking scope boundaries: Some scores include Scope 3 emissions; others do not. The boundary determines what the number actually measures.
Pro Tip: When you receive an ESG scorecard from a provider like EcoVadis or MSCI, download the underlying data factsheet before reading the summary. The factsheet shows which indicators drove the score and how much weight each carried. That context transforms a number into a story you can act on.
How to assess uncertainty and credibility in sustainability metrics
Not all sustainability numbers are equally reliable, and the gap between a credible metric and an overstated one is often invisible in a polished report. Credible sustainability measurement requires distinguishing two types of uncertainty: effect uncertainty, which is whether the intervention actually caused the measured change, and measurement uncertainty, which is whether the data collection method captured reality accurately.
Effect uncertainty is common in social metrics. A company reports a 15% improvement in employee wellbeing scores after launching a mental health program. But did the program cause the improvement, or did broader economic conditions, a change in survey methodology, or a different respondent pool explain the shift? Without a control group or a baseline established before the intervention, the causal claim is weak.
Measurement uncertainty is pervasive in environmental metrics, particularly in Scope 3 emissions. Spend-based emission factors carry error ranges of 30% to 50% in many categories. Reporting a Scope 3 figure to two decimal places implies a precision that the underlying data cannot support.
Transparency about what you responsibly know, and what you do not, is the foundation of credible sustainability disclosure. If your measurement method cannot support a precise figure, communicate a range or a qualified estimate rather than a false precision that will erode trust when audited.
The practical test for credibility is straightforward. Ask whether the data was independently verified. Check whether the methodology is documented and reproducible. Look for consistency between the narrative in the main report and the numbers in the appendix. Raw data fact sheets and appendices contain audited, tabular figures that often expose inconsistencies hidden beneath a glossy summary. If the story and the spreadsheet disagree, trust the spreadsheet.
Step-by-step approach to turning sustainability data into decisions
Measuring sustainability performance is only half the job. The other half is translating data into decisions that improve compliance and business outcomes. The following sequence works for managers at mid-size and large companies regardless of the reporting framework they use.
-
Start with raw data, not summary reports. Pull the underlying fact sheets and appendices before reading the executive summary. Audited tabular data is more reliable than narrative descriptions, and inconsistencies between the two are a red flag worth investigating.
-
Verify metric defensibility. For each KPI on your dashboard, confirm it has a documented formula, a recognized framework alignment such as GRI or ESRS, a defined measurement cadence, and a disaggregation structure. Metrics that fail this check should be rebuilt or retired.
-
Separate absolute from intensity metrics. Absolute metrics, such as total tonnes of CO2 equivalent, track planetary impact. Intensity metrics, such as emissions per unit of revenue, track efficiency. Both matter, but they answer different questions. Use absolute figures for climate target-setting and intensity figures for operational benchmarking.
-
Benchmark against peers and targets. Integrated Sustainable Value frameworks that combine resource efficiency metrics with network connectivity analysis can reveal cross-tier sustainability risks invisible to simple indicator-level reporting. At minimum, compare your metrics against sector averages from CDP, SASB industry standards, or your EcoVadis peer group.
-
Link every metric to a business decision. A metric that has not informed a decision in six months is consuming reporting resources without generating value. Review your KPI list quarterly and retire any indicator that no longer connects to a compliance requirement, a strategic target, or an operational improvement.
-
Communicate uncertainty honestly. When a metric carries high measurement uncertainty, say so. Qualified disclosure, such as “estimated Scope 3 emissions of 12,000 to 18,000 tonnes CO2e based on spend-based factors,” is more credible than false precision and more defensible under CSRD audit requirements.
The table below summarizes the decision-usefulness test for common sustainability KPIs.
| Metric | Decision it should inform | Red flag if absent |
|---|---|---|
| Scope 1 and 2 emissions (absolute) | Net-zero target progress and EU Taxonomy alignment | No year-on-year trend data |
| Water withdrawal by source | Water risk management and site-level efficiency | No disaggregation by facility |
| Employee injury rate (TRIR) | Safety investment and ESRS S1 compliance | No benchmark against industry average |
| Supplier ESG score | Procurement decisions and CSRD value chain disclosure | No methodology documentation |
Pro Tip: Build a one-page metric charter for each KPI on your sustainability dashboard. Include the formula, the data owner, the measurement frequency, the framework it aligns to, and the decision it informs. This single document will save hours during audits and make onboarding new team members far faster.
For a deeper look at sustainability KPIs for CSRD, the Econos-esg blog covers how Romanian and EU companies are structuring their indicator sets for compliance.
Key takeaways
Interpreting sustainability metrics well requires knowing the metric type, verifying its formula and framework alignment, distinguishing absolute from intensity data, and connecting every indicator to a real business decision.
| Point | Details |
|---|---|
| Know your metric type | Output, outcome, composite, and longitudinal metrics each answer different questions and require different interpretation. |
| Verify defensibility first | Every credible KPI needs a documented formula, framework alignment, measurement cadence, and disaggregation logic. |
| Absolute beats intensity for impact | Intensity metrics can mask rising absolute emissions; use absolute volume data for climate target-setting. |
| Read the raw data appendix | Audited fact sheets expose inconsistencies that polished summary reports conceal. |
| Retire unused metrics | A KPI that has not informed a decision in six months is documentation, not a management tool. |
What I have learned from years of reading sustainability data
After working with companies like Michelin, eMAG, and Raiffeisen Bank on their ESG reporting, I will admit something that most consultants avoid saying: the majority of sustainability dashboards I encounter contain at least one metric that nobody actually uses to make a decision. It sits there because someone added it three years ago to satisfy a questionnaire, and nobody has had the courage to retire it. That metric is not harmless. It consumes data collection time, creates audit exposure, and dilutes attention from the indicators that genuinely matter.
The second pattern I see consistently is the confusion between a better score and better performance. A company improves its EcoVadis rating from 45 to 58 and celebrates. But when you open the underlying data, the improvement came entirely from better documentation of existing practices, not from any reduction in emissions or improvement in working conditions. The score went up because the company got better at reporting, not because it got better at operating. That distinction matters enormously when you are trying to use sustainability data for strategic ESG compliance rather than just external communication.
My honest recommendation is to treat your sustainability metric set as a living document with a strict admission policy. Every new KPI must pass the defensibility test and demonstrate a clear link to a decision before it earns a place on the dashboard. And every existing KPI should face a quarterly review. The goal is not a comprehensive catalog of everything you measure. The goal is a short list of numbers that make you smarter about running your business.
— Mathieu
How Econos-esg helps you make sense of your sustainability data

Econos-esg works with mid-size and large companies to transform raw sustainability data into decision-useful KPIs that satisfy CSRD, EcoVadis, and EU Taxonomy requirements. The team brings direct experience across 17 industries and over 158 completed projects, which means the guidance you receive is grounded in what actually works in practice, not in theory.
If carbon metrics are your priority, the carbon footprint assessment service covers Scope 1, 2, and 3 with the formula transparency and framework alignment that auditors and rating agencies expect. For companies building or overhauling their full reporting structure, the ESG reporting service integrates metric interpretation directly into your compliance and strategy workflow. Econos-esg also offers ECONOS Academy training so your team builds the internal capacity to read and act on sustainability data independently, without ongoing consultant dependency.
FAQ
What does interpreting sustainability metrics mean?
Interpreting sustainability metrics means understanding what each indicator measures, how it was calculated, and what it implies for business performance and compliance. It goes beyond reading a number to evaluating its formula, framework alignment, and decision relevance.
How do GRI and SASB differ in sustainability metric analysis?
GRI focuses on a company’s impact on the environment and society, making it suitable for broad stakeholder reporting. SASB focuses on financially material sustainability risks within specific industries, making it more useful for investor-facing disclosure and sector benchmarking.
Why do ESG scores vary between rating providers?
ESG scores vary because providers like MSCI and Sustainalytics use different methodologies, weightings, and data sources. A score from one provider reflects that provider’s model, not an objective measure of a company’s sustainability performance.
What is the difference between absolute and intensity sustainability metrics?
Absolute metrics measure total volume, such as total tonnes of CO2 emitted, while intensity metrics measure efficiency relative to a business variable like revenue or production output. Absolute metrics track planetary impact; intensity metrics track operational efficiency.
How do you know if a sustainability metric is credible?
A credible metric has a documented formula, an independent verification process, and consistency between the summary report and the underlying raw data appendix. If the narrative and the numbers disagree, the metric’s credibility is in question.